
VAR’s Investment Director, Jonathan Eldridge summarises the state of affairs for the world’s reserve currency, US Dollar.
Executive Summary
Current Dollar Weakness
- Investor Focus: Dollar weakness has been a significant concern for investors, particularly intensifying in recent weeks.
- Long-Term Trends: Since the Global Financial Crisis (GFC), the dollar has been in a structural bull market due to:
- Strong US economic growth.
- Attractive interest rates.
- Safety of US assets.
- Deep capital markets.
Recent Developments
- Peak and Volatility: The dollar peaked in 2022 and has been rangebound since, with recent downward pressure.
Driving Factors of Dollar Weakness
Structural Factors
- Declining Yield Advantage: The yield advantage of US Treasuries over other bonds is decreasing.
- Narrowing Growth Differential: The US growth advantage over peers is narrowing, particularly with expected fiscal stimulus in Europe. Concerns about US debt sustainability are rising.
Tactical Factors
- Erratic US Policies: Unpredictable policies have increased uncertainty among investors.
- Increased Hedging: Foreign investors may have been hedging more of their USD-denominated investments, contributing to volatility.
VAR’s Perspective on USD Outlook
- Medium-Term Concerns: Questions about fiscal sustainability and narrowing GDP growth advantages could impact investor confidence.
- Potential Tailwinds: Despite negative sentiment, there are potential factors that could support the dollar in the short term (for instance oversold conditions) and the long-term (for instance stablecoin growth)
- Yield Considerations: Real yields in the US remain higher than in other regions, which may justify holding US bonds despite dollar weakening.
Equity Portfolio Positioning
- Overweight US Equities: VAR maintains a modest overweight in US equities due to, among other things, quality metrics.
- Focus on European Growth: Increasing attention to emerging growth opportunities in Europe, with recent investments in companies like Assa Abloy, Ryanair, and Safran.
- Cash Management: The portfolio holds some cash, which has decreased as capital is deployed into new opportunities.
Full Note
Why has USD performed so well historically?
In recent years, dollar strength has been a key macro theme within markets. In the charts below, we look at USD performance against both the EUR (left hand chart) and GBP (right hand chart):
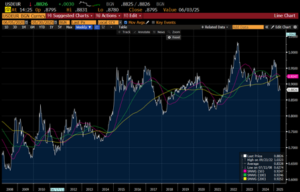

Fig 1: USD relative to EUR & GBP; Source: Bloomberg
EUR and GBP are two currencies that are of particular interest to VAR clients, but it’s fair to say that dollar strength has been a general theme and hasn’t just been confined to the pairs we reference above. In the chart below, we look at the performance of DXY, which is essentially the dollar’s performance relative to a wider basket of currencies on a trade weighted basis:
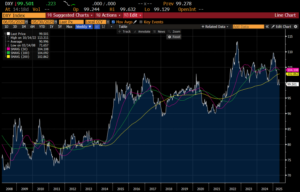
Fig 2: Dollar relative to trade weighted basket of currencies; Source: Bloomberg
In terms of understanding why the dollar has done so well, the US has been an attractive destination for foreign investors on account of:
- Better GDP growth in the US relative to other countries
- Higher quality companies positioned in more attractive sectors
- Relatively more attractive real rates available for on US fixed income securities
- Deep and liquid markets that are able to absorb meaningful capital flows arising from trade surpluses that foreign countries “enjoy” with the US
- Perceived safety of US assets in terms of shareholder rights and rule of law
Examining these bull points in turn, first we turn to relative GDP growth rates. The US has long been perceived as a more dynamic economy relative to Europe or Japan due to more easily available capital, greater flexibility in labour markets and better productivity growth, among other reasons. Looking at the data, while the drivers could be the subject of another (long) article, the evidence is quite clear. In the chart below, we compare the YoY growth in GDP in the US and the Eurozone using quarterly data since the mid-90’s – the quarterly differences are the dotted red line, while the long-term average difference is the solid red line. On average, the US economy has grown roughly 1% more quickly (2.5% vs 1.5%) per annum than the Eurozone economy:
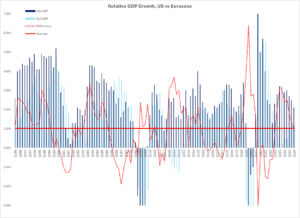
Fig 3: US growth relative to European growth; Source: VAR estimates
Crucially, US budget deficits (which probably helped to juice the growth rate), while expanding, were seen as manageable within the context of a growing domestic economy and a global economy ex-US that had a seemingly insatiable appetite for “safe” US assets into which they could park their burgeoning trade surpluses with the US. The demand for these US assets has, of course, been predicated on the US indeed being a safe location for these flows, a point that we’ll come back to.
In terms of the US being home to better quality companies, on average, that are active in more attractive sectors of the global economy, there are a few ways this dynamic can be demonstrated. In the left-hand chart below, we show the return on equity (ROE) for the S&P in aggregate, relative to the ROE on aggregate for global equities excluding US, and here we see that the difference is large and growing. While a part of the gap is linked to the emergence of the “Magnificent 7” companies, we see that even in 2010 (well before that theme became a focus for investors), the difference was meaningful. An alternative way to understand the gulf in quality between US companies and ex-US companies would be through an analysis of gross margins. High gross margins tend to be a good indicator of pricing power in that, simply put, a company with a gross margin of 80% is able to buy raw materials for 20 and sell them for 100, indicative of favourable dynamics in their end markets; a company with a gross margin of 20% is only able to sell those raw materials costing 20 at a price of 25, indicating relatively less pricing power. Pricing power isn’t the only indicator of quality (VAR portfolios own some companies with low gross margins that we consider to be quality companies, for instance Avery Dennison and Home Depot), but it’s a useful blunt instrument for assessing quality. In the table on the right hand side we take every listed company in the US, Europe and Asia with a market capitalization of more than $1bn and rank them in deciles by gross margin:
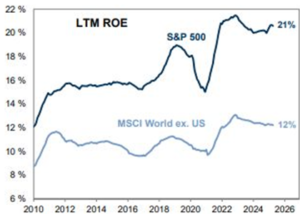
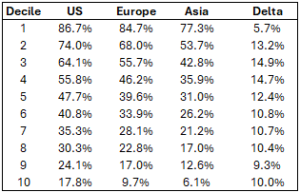
Fig 4: US vs ROW ROE; Source: Goldman Sachs; Gross margin deciles of US, European & Asian companies; Source: Bloomberg, VAR Estimates
The simple interpretation of this is that decile 1 gives you the top 10% of companies in each region by gross margin, and tells you the average gross margin of companies in that bracket, i.e. 86.7% for decile 1 in the US tells you that the top 10% of companies in the US by gross margin make an average gross margin of 86.7%, while for Asian companies, the elite top decile group makes an average gross margin of 77.3%. What is interesting about the table is that again we see that the US dominates Europe and Asia, meaning that across each decile, US companies tend to be considerably more profitable (at the gross margin level) than their peers. The Mag7 have certainly contributed to better US corporate performance, but it seems clear to us that something more widespread is going on here, and this has meant that the rest of the world has been happy to own US companies, and to buy USD to support those purchases.
If we then look at the relatively more attractive real rates (by real rates we mean sovereign bond yields minus expected inflation, i.e the “real” increase in purchasing power offered) available in the US, we find that there has typically been a yield advantage to US bonds (the red line in the bottom left chart), with that widening spread often coinciding with periods of USD strength.
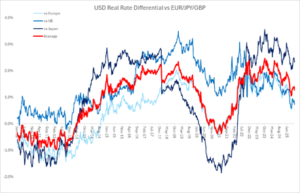
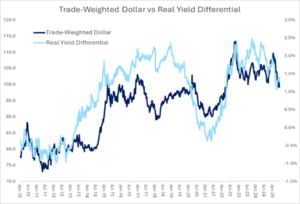
Fig 5: USD real rates relative to peers; Source: Bloomberg, VAR Estimates; Real rate differentials vs Trade-Weighted Dollar; Source: Bloomberg, VAR Estimates
In summary, the broad USD strength that we’ve seen over the long-term has probably been driven by more attractive US growth rates, better companies to invest in, and more attractive real rates available in the US. As the rest of the world increased their trade surpluses with the US (dollar negative), that probably created more demand for “safe” (in the sense of strong and enforceable investor rights) assets, namely USD assets.
What’s Changed this year?
The most obvious answer is “President Trump”, however we’re investors, not political pundits with an ideological axe to grind, so a less glib explanation is warranted.
First, we referred to the US as being home to better quality companies positioned in more attractive sectors of the global economy – we don’t see that dynamic changing; however, let’s also look at our first point on relative rates of growth. Re-examining Fig 3, one sees that while the average GDP growth rate the US enjoys is still superior to Europe, that gap is narrowing (note the dotted line sloping downward). We’d also note that markets tend to look forward, not in the rear-view mirror, and on a forward-looking basis, the picture is relatively less optimistic for the US. In the charts below, we look at consensus expectations for GDP growth for 2025 across the US, Europe and the UK:
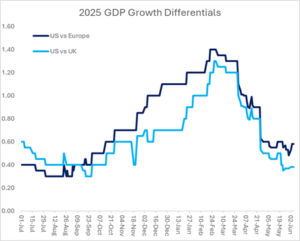
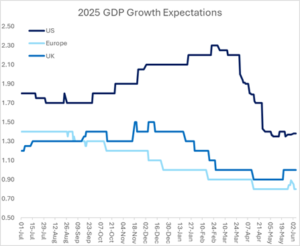
Fig 6: Expected GDP growth rates by region; Source: Bloomberg, VAR Estimates
In the first chart, we simply chart estimates by region, while in the second, we look at the growth in the US minus the growth in the other regions to show the growth premium the US enjoys. What is noticeable on the two lines in the right-hand chart is that, while the US is still expected to grow more quickly relative to either Europe or the UK in 2025, that difference is expected to be modest (40bps-60bps), and expectations for the US relative to other regions have been compressing since the early part of 2025, with the compression accelerating over the course of the Liberation Day. In terms of understanding why the “US Growth Premium” is shrinking, from the US side, the market appears to be taking the view that nobody wins from tariffs, but the US loses more. This has driven most of the compression, in our view. What’s particularly interesting is that, as President Trump’s economic advisors no doubt informed him before Liberation Day, Economics 101 teaches that, all other things being equal, higher tariffs ought to lead to USD strengthening (indeed this is what we saw on the first iteration of tariffs over President Trump’s first term), however in 2025 we’re seeing the opposite in terms of the move in the dollar, with more pessimistic US growth expectations possibly playing some role in the differing currency behaviour.
In addition to the “weaker US” narrative, though, we think that investors are becoming cautiously more optimistic on European growth, probably due to fiscal stimulus happening in that part of the world. The most headline-catching developments here are probably:
1) The massive ramp up in defence spending in Europe as the Pax Americana peace dividend disappears into the rear-view mirror, which should boost revenues for European aerospace and defence company revenues, along with the extensive list of companies that are peripheral to these direct beneficiaries
2) The ~€500bn 10 year fiscal stimulus plan announced in Germany recently, which is meaningful as a percentage of German GDP (even spread over 10 years), and ought to generate knock-on benefits outside of Germany in the wider Eurozone.
Aside from the deteriorating US growth advantage, probably another linked consideration is the worsening US fiscal situation.
The chart below (Fig 8) shows US budget surpluses/deficits as a percentage of GDP year by year since The Great Depression, with recessions highlighted in grey. It’s beyond the scope of this article to go too deeply into the context of this dynamic, but it’s clear that deficits have been a more or less permanent feature of the US economy (regardless of the party in power), and those deficits have been growing as a percentage of GDP (and even more dramatically in dollar terms) over the last 20 years, implying rising debt to GDP Fig 7). That’s not a problem (to a point) provided lenders are willing to lend (as they have been), but the longer the dynamic persists, the less they ought to be willing to do so, all other things being equal.
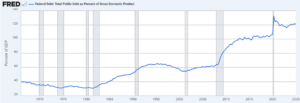
Fig 7: US Federal debt relative to GDP; Source: St Louis Fed
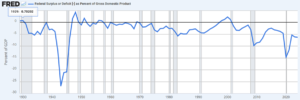
Fig 8: US Federal surplus/deficit relative to GDP; Source: St Louis Fed
The exact dynamics of when government debt becomes a problem and how to time investments around that is notoriously tricky (the 2011 book “This Time Is Different” by Reinhart & Rogoff is an interesting read on the topic, for those interested), however we think that, alongside the more general attempt by the market to contemplate the risks around the dollar’s “reserve currency” status being at risk, this gradually worsening debt dynamic has been on the back of investors’ minds. More recently, the “Big Beautiful Bill” announced in the US, which many commentators believe will worsen debt dynamics overall, has probably not been helpful in this regard.
Next, the real yield advantage that US bonds enjoy relative to their peers in Europe, Japan and the UK has been shrinking. The yield advantage peaked in the summer of 2023 and has since been compressing (see chart below):
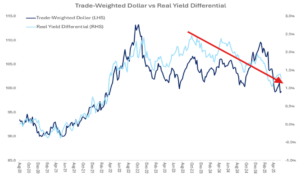
Fig 9: Trade-weighted USD and real yield differentials vs UK, Europe, Japan; Source: Bloomberg, VAR estimates
Meanwhile, we note that according to the consensus among economists, rate cuts over the next year are expected to be slightly larger in the US relative to other currency blocs. In the table below, we highlight current expectations of 74bps of rate cuts in the US, which compares to about 70bps of cuts in the UK, just 24bps of cuts in Europe, and 26bps of hikes in Japan:
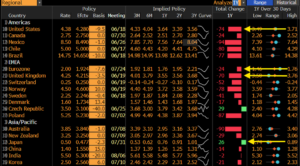
Fig 10: Global interest rate expectations; Source: Bloomberg
All other things being equal, a more dovish Fed might be a reason for the US real yield premium to continue to erode, which could also have played some role in the poor performance of the dollar.
Finally, we’d note that all of the changing dynamics that we’ve noted this year have resulted in increasing volatility in the daily moves of the dollar. In the left-hand chart below, we plot the standard deviation of daily moves in USD relative to EUR, GBP, and JPY, and note that there has been a meaningful pickup, more or less since the Trump election win. What’s interesting about the increase in volatility is that holders of USD-denominated assets have often been willing to hold these assets unhedged, i.e. a Taiwanese insurance company reporting in TWD might hold US treasuries and not hedge out the risk of the USD depreciating against the TWD, which would inflict a loss on the insurer. We find this lack of hedging to be the case more often in the case of holdings in equities, however it also appears to be a feature (to a lesser extent) with regards to bond holdings (see bottom right chart). Looking at why foreign holders of USD-denominated assets might be willing to assume the currency risk associated with those assets, firstly there’s a cost to hedge, but probably equally important has been the fact that, until recently, the dollar has been strong, so not hedging has been a tailwind for returns. Looking at what’s changed recently, given that there is discussion in the market around the sustainability of US deficits, the seemingly erratic nature of US policymaking, and, on a more prosaic note, more day-to-day volatility, one might reasonably expect that foreign holders of USD-denominated assets might be having high-level discussions on the prudence of running unhedged exposures. Given the sheer scale of foreign holdings of US assets, even a 1% increase in the overall share of those holdings that are FX-hedged might represent a meaningful amount of selling pressure on the dollar. Accessing good, real-time data on hedge ratios is challenging, so it’s hard to draw any concrete conclusions, but it’s nevertheless an interesting point to reflect on.
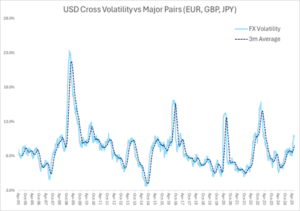
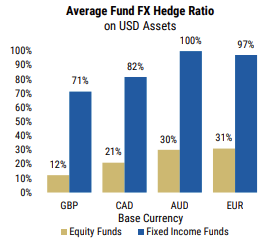
Fig 11: Realised FX volatility; Source: Bloomberg, VAR Estimates; Global US asset holding hedge ratios; Source: Morgan Stanley
Where to from here?
At VAR we focus on what we can control – security selection is one of those things, but currency moves are not on the list. As we discuss below, focusing on security selection has worked well for us this year, but given our investments in USD-denominated securities, we try to be mindful of the risks. On a medium-term view, we can see the case for a further modest correction in USD. The key reasons for this, in our minds, are the US debt dynamics (probably worsened by the Big Beautiful Bill), erratic policymaking, and the fact that, while the dollar has corrected recently, it still remains quite overvalued relative to its long-term history (for instance, JP Morgan, an investment bank, recently argued for a further ~10% devaluation in USD relative to EUR over a 10-15 year time horizon). To these risks, we’d add that global institutions increasingly choosing to either diversify their allocations away from the US for the above reasons, or at least currency hedge the exposures that they do run, ought to represent a further headwind.
With that being said, further dollar weakness is by no means a given. Over the short-term, we note that sentiment on the dollar is very negative and very one way. In the chart below, we summarise the most recent findings from the Bank of America Merrill Lynch investor sentiment survey, where institutional investors are asked for the opinions and positioning in respect to various macroeconomic and strategic factors (typically which regions and sectors they are bullish and bearish on, which currencies and commodities they are bullish and bearish on, and so on). In the most recent survey, the findings on the dollar were that bearish bets are as negative as they’ve been in about 20 years. While we’re not advocating reflexively taking the other side of any consensus view, often it pays to look at the other side of the argument.
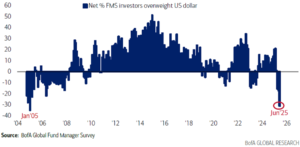
Fig 12: Investor sentiment on USD; Source: Merrill Lynch
Longer-term, there are also reasons not to get too down on the dollar. In “risk off” environments, or in ones where there is heightened perceived tail risk (US strikes on Iran might tick this box), the dollar tends to do well. Another left-field reason for the dollar to do well could be the rise of stablecoins (that is cryptocurrencies “pegged” to a stable asset such as gold or treasuries), which could be a meaningful driver of demand for USD-denominated assets – indeed Treasury Secretary Scott Bessent recently pointed to research suggesting that this could be a $3.7trn market by the end of the decade (https://x.com/SecScottBessent/status/1935027160374210573). Simply put, further dollar weakness is possible, but it’s not a given.
Over the long-term, though, we wouldn’t be that surprised to see a bit more dollar weakness, however in the short-term, dollar looks quite oversold and it wouldn’t take much to drive a dollar relief rally
What is VAR doing?
Looking at how we’re positioned and what we’ve been doing in light of the broad macro currents that we’ve noted, we do retain an overweight in US equities, mainly on the argument above that one tends to find more high-quality companies in the US. We do, however, continue to hold some cash (though the cash balance has declined since our last update, given that we deployed some capital into new opportunities as markets sold off over Liberation Day). As things currently stand, the portfolio is about 6.5% overweight the US and roughly in-line with the benchmark allocation to Europe, with small to medium underweights in the majority of the other overall regional blocs, with the combined underweights elsewhere outweighing the overweight position in the US on account of the cash holding (see left-hand chart below). In spite of the headwinds from:
- Holding cash in an up market
- Having an overweight position in US stocks, which have underperformed YTD in local currency
The VAR equity portfolio has kept pace with a currency-neutral benchmark (see right-hand chart below), mainly because our stock picking has worked well this year (some of the higher-profile examples of outperformers include Dassault Aviation, Eiffage, Netflix, and Verisign).
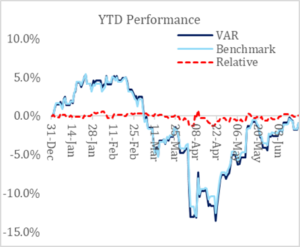
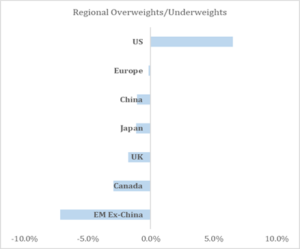
Fig 13: VAR exposures & performance; Source: VAR estimates
Looking at what we have been doing in the portfolio given the fluid situation we’ve described, we’ve been selectively adding to our European exposure. Since the GFC, global investors looking to buy European equities at cheap valuations relative to US equities have had many disappointments, and we’re mindful of that risk, but nonetheless we’re sympathetic to the arguments around improving relative growth and quite compelling fiscal stimulus in Europe, which ought to support European shares. While the quality of European listed companies is, on average, lower, that’s not to say that there are no quality companies, or compelling opportunities in Europe. We’ve recently added Ryanair (a growing airline that has an insurmountable cost advantage relative to its competitiors that allows it to generate good returns and to continue to take market share) to the portfolio, along with Safran (an aerospace and defence business with an excellent civil aviation joint venture with GE, where it enjoys a duopolistic market structure with strong visibility on earnings growth due to a growing share of aftermarket service revenues, which are enormously profitable). These are just a couple of examples of the many compelling opportunities we’re finding in Europe and adding to the portfolio.
About VAR Capital:
VAR Capital is an independent financial services firm offering asset management, lending and family office services. It was founded by individuals with extensive experience from Banking, Asset Management and Family Offices. Based in Mayfair, London, VAR Capital Ltd is authorised and regulated by the Financial Conduct Authority (FCA).
Disclaimer:
This message is provided for information purposes and should not be construed as a solicitation or offer to buy or sell any securities or related financial instruments, nor does the information constitute advice or an expression of our view as to whether a particular financial product is appropriate for you. Please note that we do not provide any tax or legal advice and clients must seek their own tax advice independently.
Source: VAR Capital
Media Contact: Vikash Gupta, [email protected]